调试测试
Playwright Inspector 是一个强大的调试工具。它会打开一个浏览器窗口,在您逐行执行测试时高亮显示选择器。您还可以使用 “Explore” 按钮查找其他可用的 selectors,将其复制到测试文件中并重新运行测试以验证是否通过。有关选择器调试的详细说明,请参阅 此处。
Playwright Inspector
Playwright Inspector 是一个 GUI 工具,可帮助编写和调试 Playwright 脚本。这是我们推荐用于脚本故障排除的默认工具。
有几种打开 Playwright Inspector 的方法:
PWDEBUG
设置 PWDEBUG 环境变量以在调试模式下运行脚本。这将配置 Playwright 进行调试并打开检查器。
- Bash
- PowerShell
- Batch
PWDEBUG=1 pytest -s
$env:PWDEBUG=1
pytest -s
set PWDEBUG=1
pytest -s
设置 PWDEBUG=1 时,会配置其他有用的默认值:
- 浏览器以有头模式启动
- 默认超时设置为 0(= 无超时)
使用 PWDEBUG=console 将配置浏览器以在开发者工具控制台中进行调试:
- 有头运行:浏览器始终以有头模式启动
- 禁用超时:将默认超时设置为 0(= 无超时)
- 控制台助手:在浏览器中配置
playwright对象以生成和高亮显示 Playwright 选择器。这可用于验证文本或复合选择器。
- Bash
- PowerShell
- Batch
PWDEBUG=console pytest -s
$env:PWDEBUG="console"
pytest -s
set PWDEBUG=console
pytest -s
page.pause
在有头浏览器中运行时,从脚本调用 page.pause() 方法。
- Sync
- Async
# Pause on the following line.
page.pause()
# Pause on the following line.
await page.pause()
使用 Playwright CLI 中的 open 或 codegen 命令:
playwright codegen wikipedia.org
逐步执行 Playwright 脚本
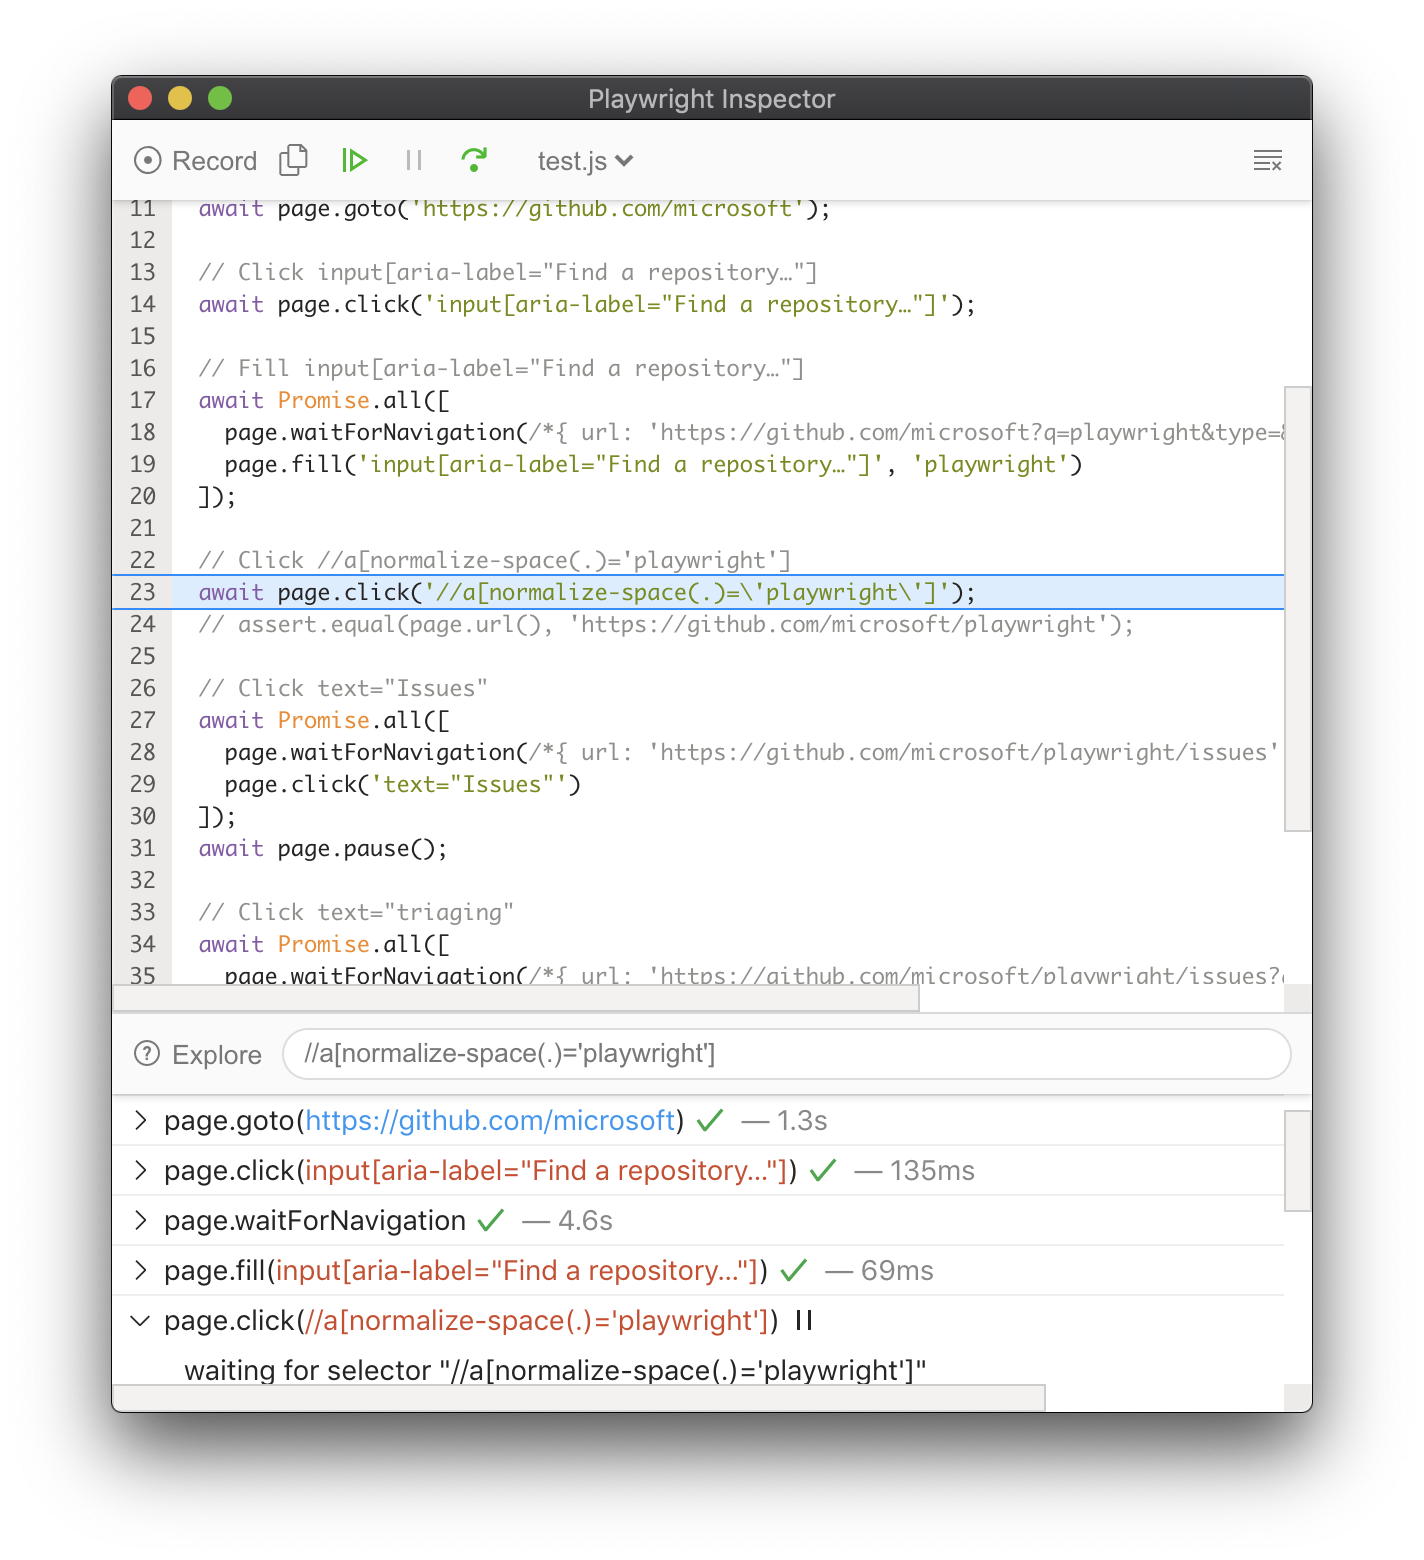
Inspector 打开一个浏览器窗口,在您逐步执行测试的每一行时高亮显示选择器。使用探索按钮查找其他可用的 选择器,然后您可以将其复制到测试文件中并重新运行测试以查看它们是否通过。

使用工具栏播放测试或使用“Step over”操作(键盘快捷键:F10)逐步执行每个操作,或在不再暂停的情况下恢复脚本(F8):

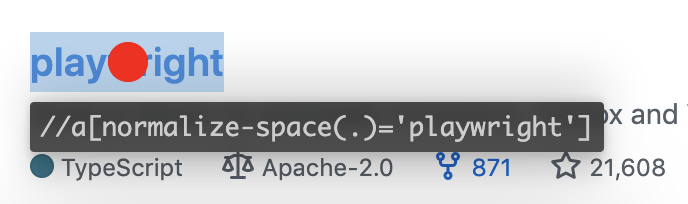
现在我们知道即将执行什么操作,我们可以查看该操作的详细信息。例如,当在输入操作(如 click)上停止时,Playwright 即将点击的确切点会在被检查的页面上用大红点高亮显示:
可操作性日志
当 Playwright 在该点击操作上暂停时,它已经执行了可以在日志中找到的 可操作性检查:
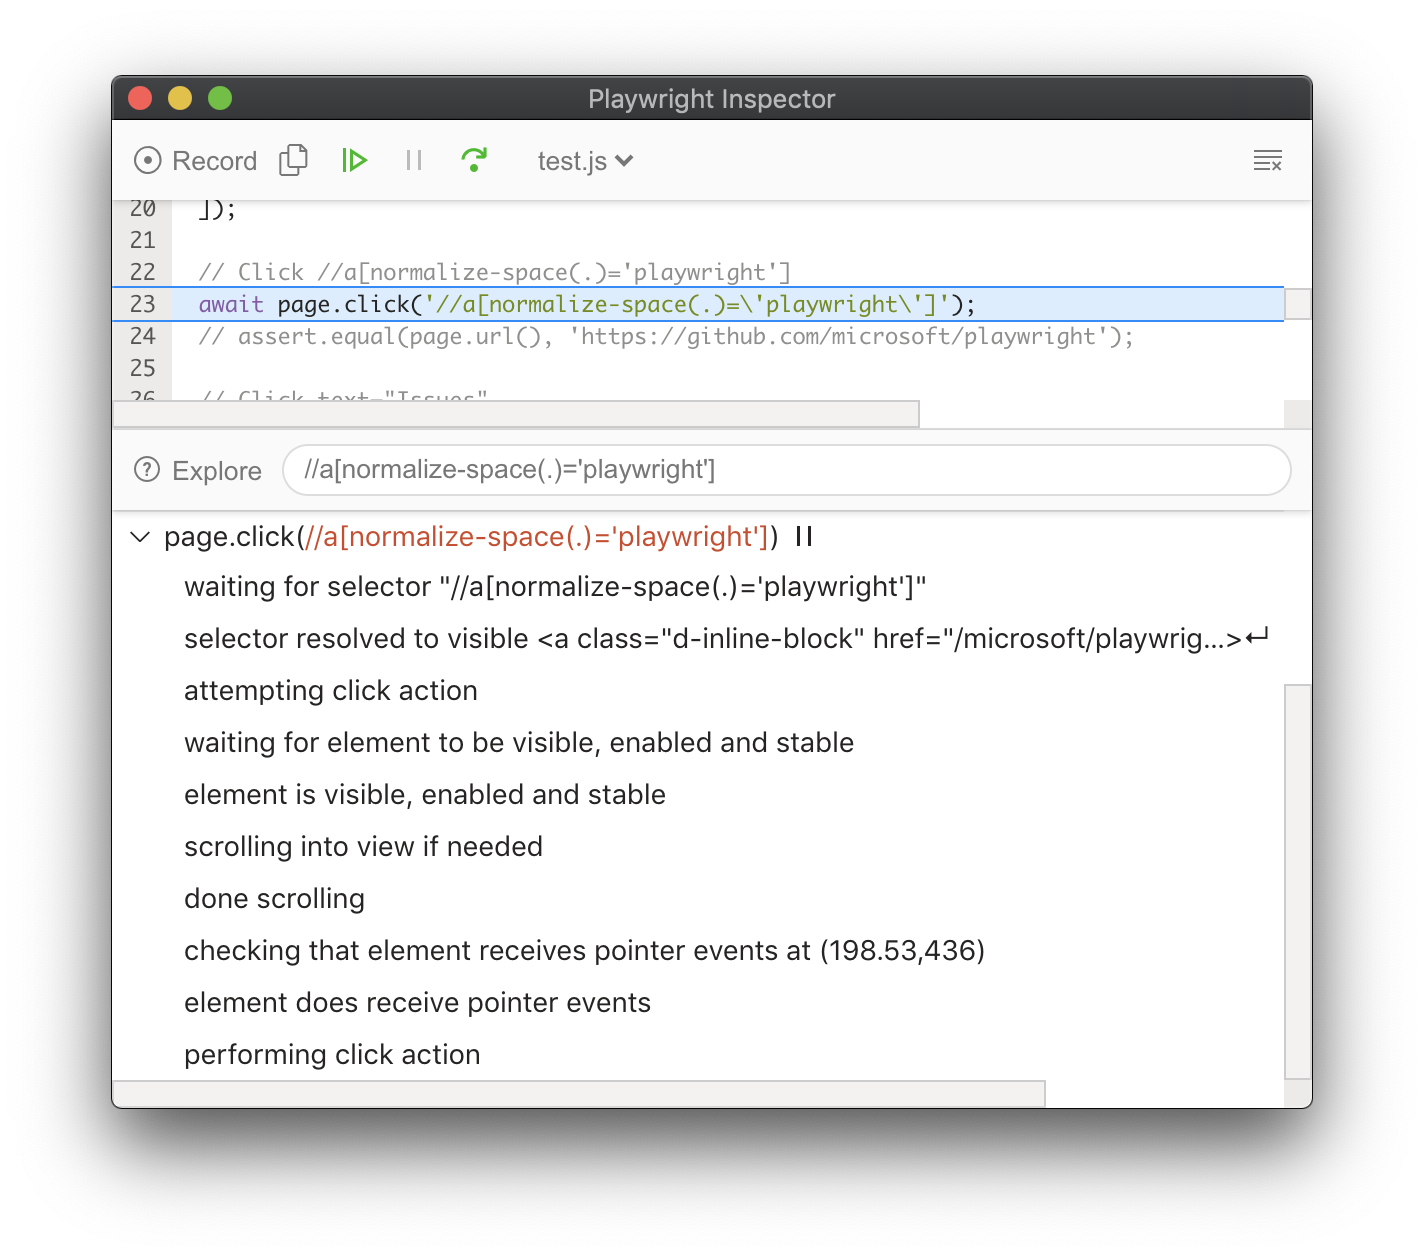
如果无法达到可操作性,它将显示操作为挂起:
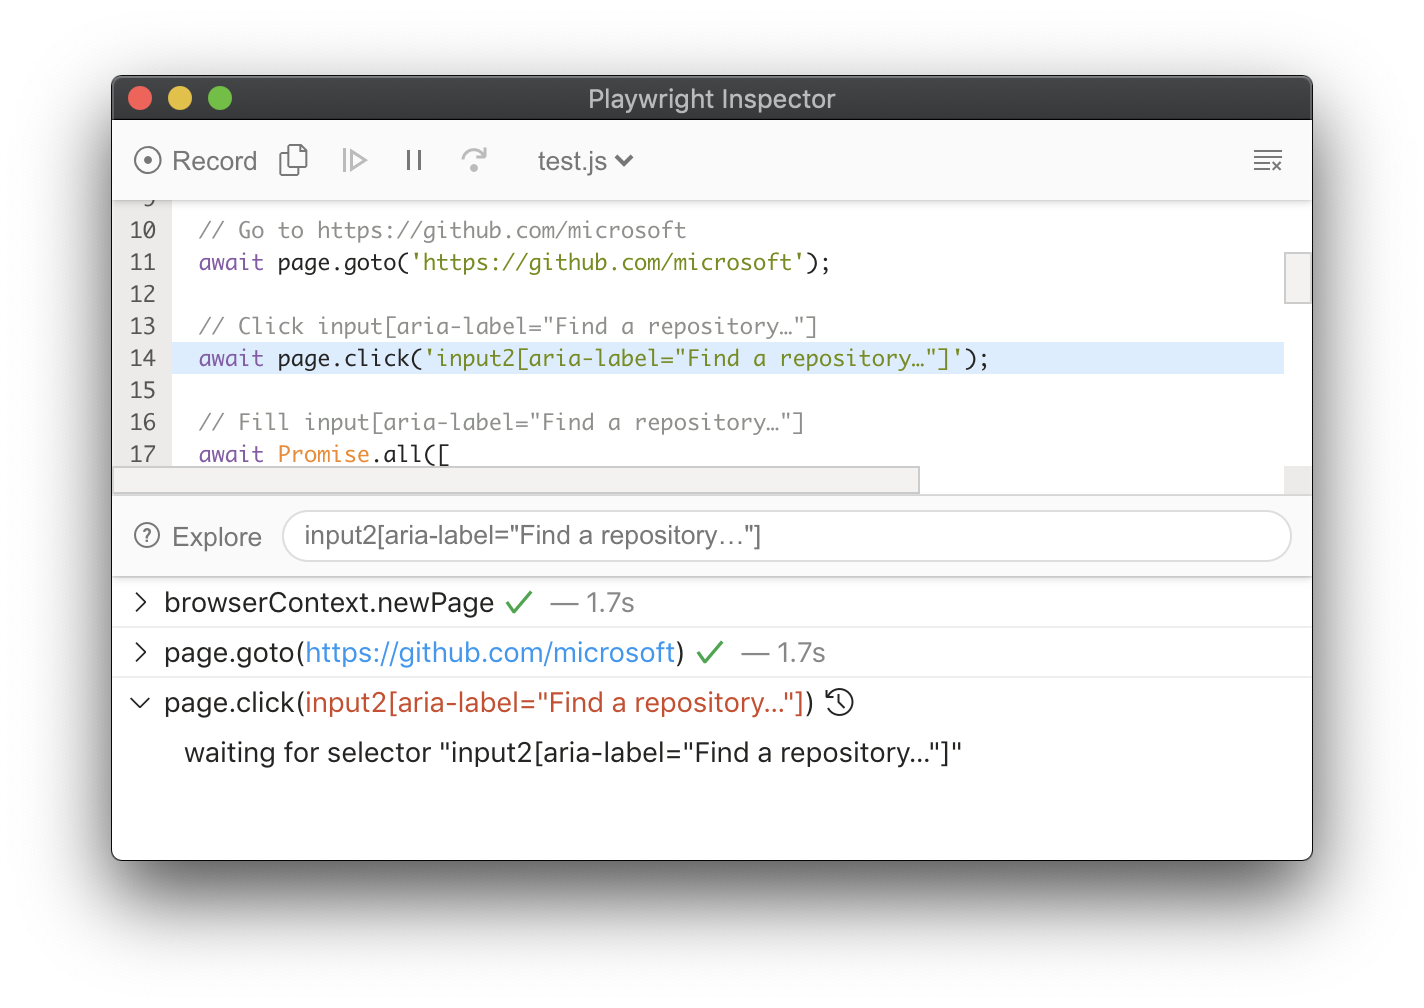
探索选择器
使用“探索”按钮将鼠标悬停在页面上的元素上,并通过单击它来探索其选择器。然后,您可以将此选择器复制到您的测试中并重新运行您的测试,以查看它们现在是否通过此选择器。您还可以调试选择器,查看我们的 调试选择器 指南以了解更多详细信息。
浏览器开发者工具
在有头模式下运行 Playwright 脚本时,您可以在 Chromium、Firefox 和 WebKit 中使用浏览器开发者工具。开发者工具帮助:
- 检查 DOM 树并 查找元素选择器
- 在执行期间 查看控制台日志(或了解如何 通过 API 读取日志)
- 检查 网络活动 和其他开发者工具功能
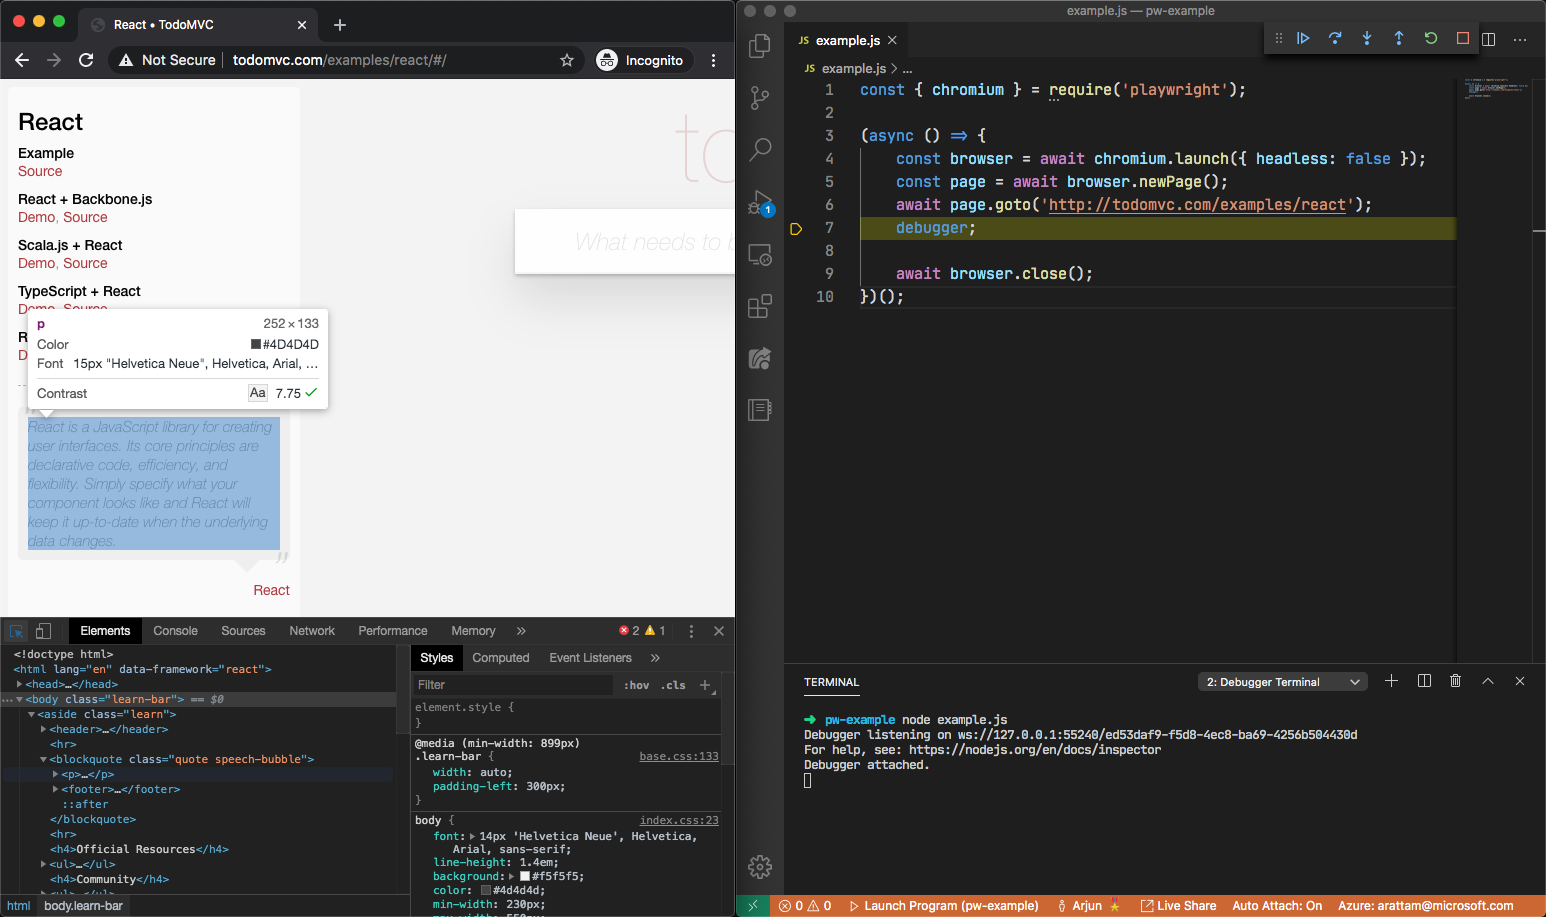
使用 page.pause() 方法是暂停 Playwright 脚本执行并在开发者工具中检查页面的简单方法。它还将打开 Playwright Inspector 以帮助调试。
针对 Chromium:您也可以通过启动选项打开开发者工具。
- Sync
- Async
chromium.launch(devtools=True)
await chromium.launch(devtools=True)
对于 WebKit:在执行期间启动 WebKit Inspector 将阻止 Playwright 脚本进一步执行。
有头模式
Playwright 默认以无头模式运行浏览器。要更改此行为,请使用 headless: false 作为启动选项。您还可以使用 slow_mo 选项减慢执行速度并在调试时跟进。
- Sync
- Async
chromium.launch(headless=False, slow_mo=100) # or firefox, webkit
await chromium.launch(headless=False, slow_mo=100) # or firefox, webkit